Note
Work in progress.
Introduction
We present the current implementation of the Science Quality Analysis Harness (SQuaSH).
SQuaSH is a web-based service for tracking Science Pipeline metrics. SQuaSH provides a REST API to which metrics values collected from pipeline tasks can be submitted and stored in a database. It enables DM developers to track the evolution of metric values over time (time series) and relate them directly to changes in code or configuration. SQuaSH adopted InfluxDB OSS as storage backend for time series data and Chronograf for time series visualization.
The current version of SQuaSH runs at https://squash.lsst.codes, and the reference documentation is available at https://squash.lsst.io.
Design guidelines
The DM Science Data Quality Assurance (SDQA) Conceptual Design [LDM-522] describes the Quality Control (QC) services required to enable the capabilities listed in the LSST Data Quality Assurance plan [LDM-63].
The general guidelines for SQuaSH are the following:
- Implement the concepts developed in the LSST Verification Framework;
- Implement a database to preserve the results of the verification runs, initially from DM Jenkins CI but also from other execution environments;
- Enable the visualization of metric values through interactive dashboards;
- Provide alert notifications upon metric value deviations from the specifications;
- Enable the drill down to external dashboards and the LSST Science Platform for exploratory analysis.
More recently, the QA Strategy Working Group Report [DMTN-085] compiled a set of recommendations for SQuaSH which are guiding its current development.
Overview
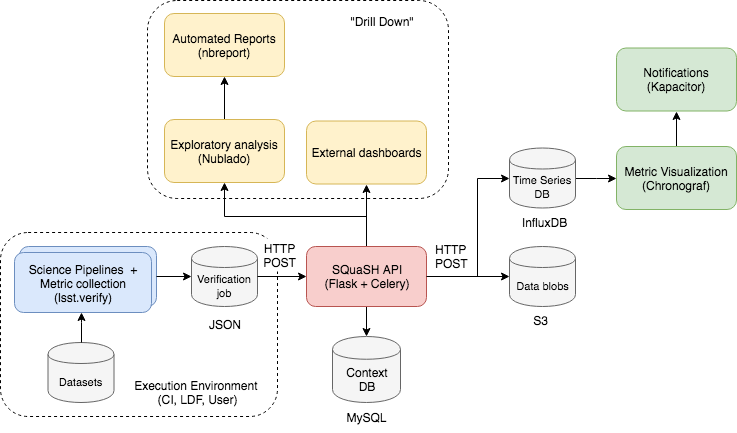
Figure 1 The figure shows the SQuaSH system and its connection to other DM tools.
Collecting metrics with the LSST Verification Framework
The LSST Verification Framework (lsst.verify) is the DM framework for collecting metrics from the Science Pipelines. It aims to generalize the process of defining metrics and specifications, persist the results in verification jobs and dispatch them to SQuaSH (see SQR-019 for a demonstration of the LSST Verification Framework).
Currently, the following pipelines run in our Jenkins CI system:
Storing results in SQuaSH
The SQuaSH REST API is a web app implemented in Flask for managing the verification jobs.
When a verification job is sent to the SQuaSH REST API, context information like metrics definition and specifications, execution environment metadata, etc are stored in the SQuaSH context database. The SQuaSH context database is a relational database using MySQL (see The SQuaSH context database).
The metric values and associated metadata (time series data) are stored primarily in InfluxDB. The resulting data is exposed through Chronograf, that is used for querying and visualizing the time series data.
Metric values
In lsst.verify, a verification package groups a set of the metric definitions and specifications. See for example verify_metrics.
In InfluxDB, we do not store metric definitions and specifications, only the metric names and values for the verification packages.
A verification package corresponds to an InfluxDB measurement, a name that groups together the metrics associated to that verification package. Metrics correspond to InfluxDB fields, the field key is the metric name always a string, for example AM1, and the field value is the metric value, typically a float number.
Metadata
A verification job includes metadata for the metrics and the execution environment.
The decision of which metadata gets stored as InfluxDB tags or InfluxDB fields follows these recommendations for the InfluxDB schema design. The type of queries we intend to do may also drive that decision given that tags are indexed in InfluxDB and fields are not.
In InfluxDB, tag values are always string, field values are usually float (see InfluxDB datatypes)
Examples of job metadata that gets stored as tags are pipeline, dataset, filter, ccdnum, visit, patch, tract or information that is commonly-queried metadata. An example of job metadata that gets stored as a field is the run_id because it would increase the time series cardinality otherwise.
The concept of series in InfluxDB is also of importance here. For each measurement any combination of tag values results in a different series in the database. That’s the basic concept behind our decision to store metric values on the smallest granularity possible, for example using ccdnum, visit or tract as tags. Then in InfluxDB we can query metric values per ccdnum, visit or tract, aggregate metric values over multiple ccdnums, visits or tracts or make a snapshot in time and create a “metric map” to visualize how the metric values change across the sky.
Note
It is not possible to join fields from different measurements in the same query in InfluxDB 1.x, this fact should be taken into account when creating new verification packages in lsst.verify. In InfluxDB 2.0 that’s not a limitation anymore.
The following table describes metadata stored as tags. It is not meant to be a complete list of tags as SQuaSH adds arbitrary metadata present in a verification job as tags by default.
| Tag key | Example of tag value | Description |
|---|---|---|
| env_name | jenkins | Name of the environment where the metrics were collected |
| pipeline | validate_drp | Name of the pipeline that collected the metrics |
| instrument | HSC | Name of the instrument that collected the data |
| dataset | validation_data_hsc | Name of dataset that was processed |
| filter | HSC-I | The corresponding filter for the dataset |
| ccdnum | 10 | The ccd ID |
| visit | 1543 | The visit ID |
| patch | 9615 | The patch ID |
| tract | 1258 | The tract ID |
| status | 0 | Status of the pipeline execution. 0-success or 1-failure |
The following table describes metadata stored as fields. SQuaSH explicitly adds these metadata as fields as opposed to tags.
| Field key | Example of field value | Description |
|---|---|---|
| timestamp | 1553859000 | Timestamp of the pipeline run in Unix time format. It is added as a field to facilitate math operations which are not possible with the original timestamps in InfluxDB. |
| run_id | 1612 | ID of the pipeline run |
| run_url | 1612 | URL of the pipeline run |
| squash_id | 3631 | ID of the corresponding verification job in SQuaSH |
| squash_url | 3631 | URL of the corresponding verification job in SQuaSH |
| code_changes | afw | List of packages that changed w.r.t the previous run_id. It is present in the jenkins environment only. |
| code_changes_counts | 7 | Number of packages that changed w.r.t the previous run_id. It is present in the jenkins environment only. |
See also this notebook that demonstrates how this data model is built.
Time-series visualization with Chronograf
The SQuaSH data model is presented to the users through the Chronograf UI. From the Chronograf UI, the user can query the metric values, the associated metadata, aggregate results and present them in interactive dashboards.
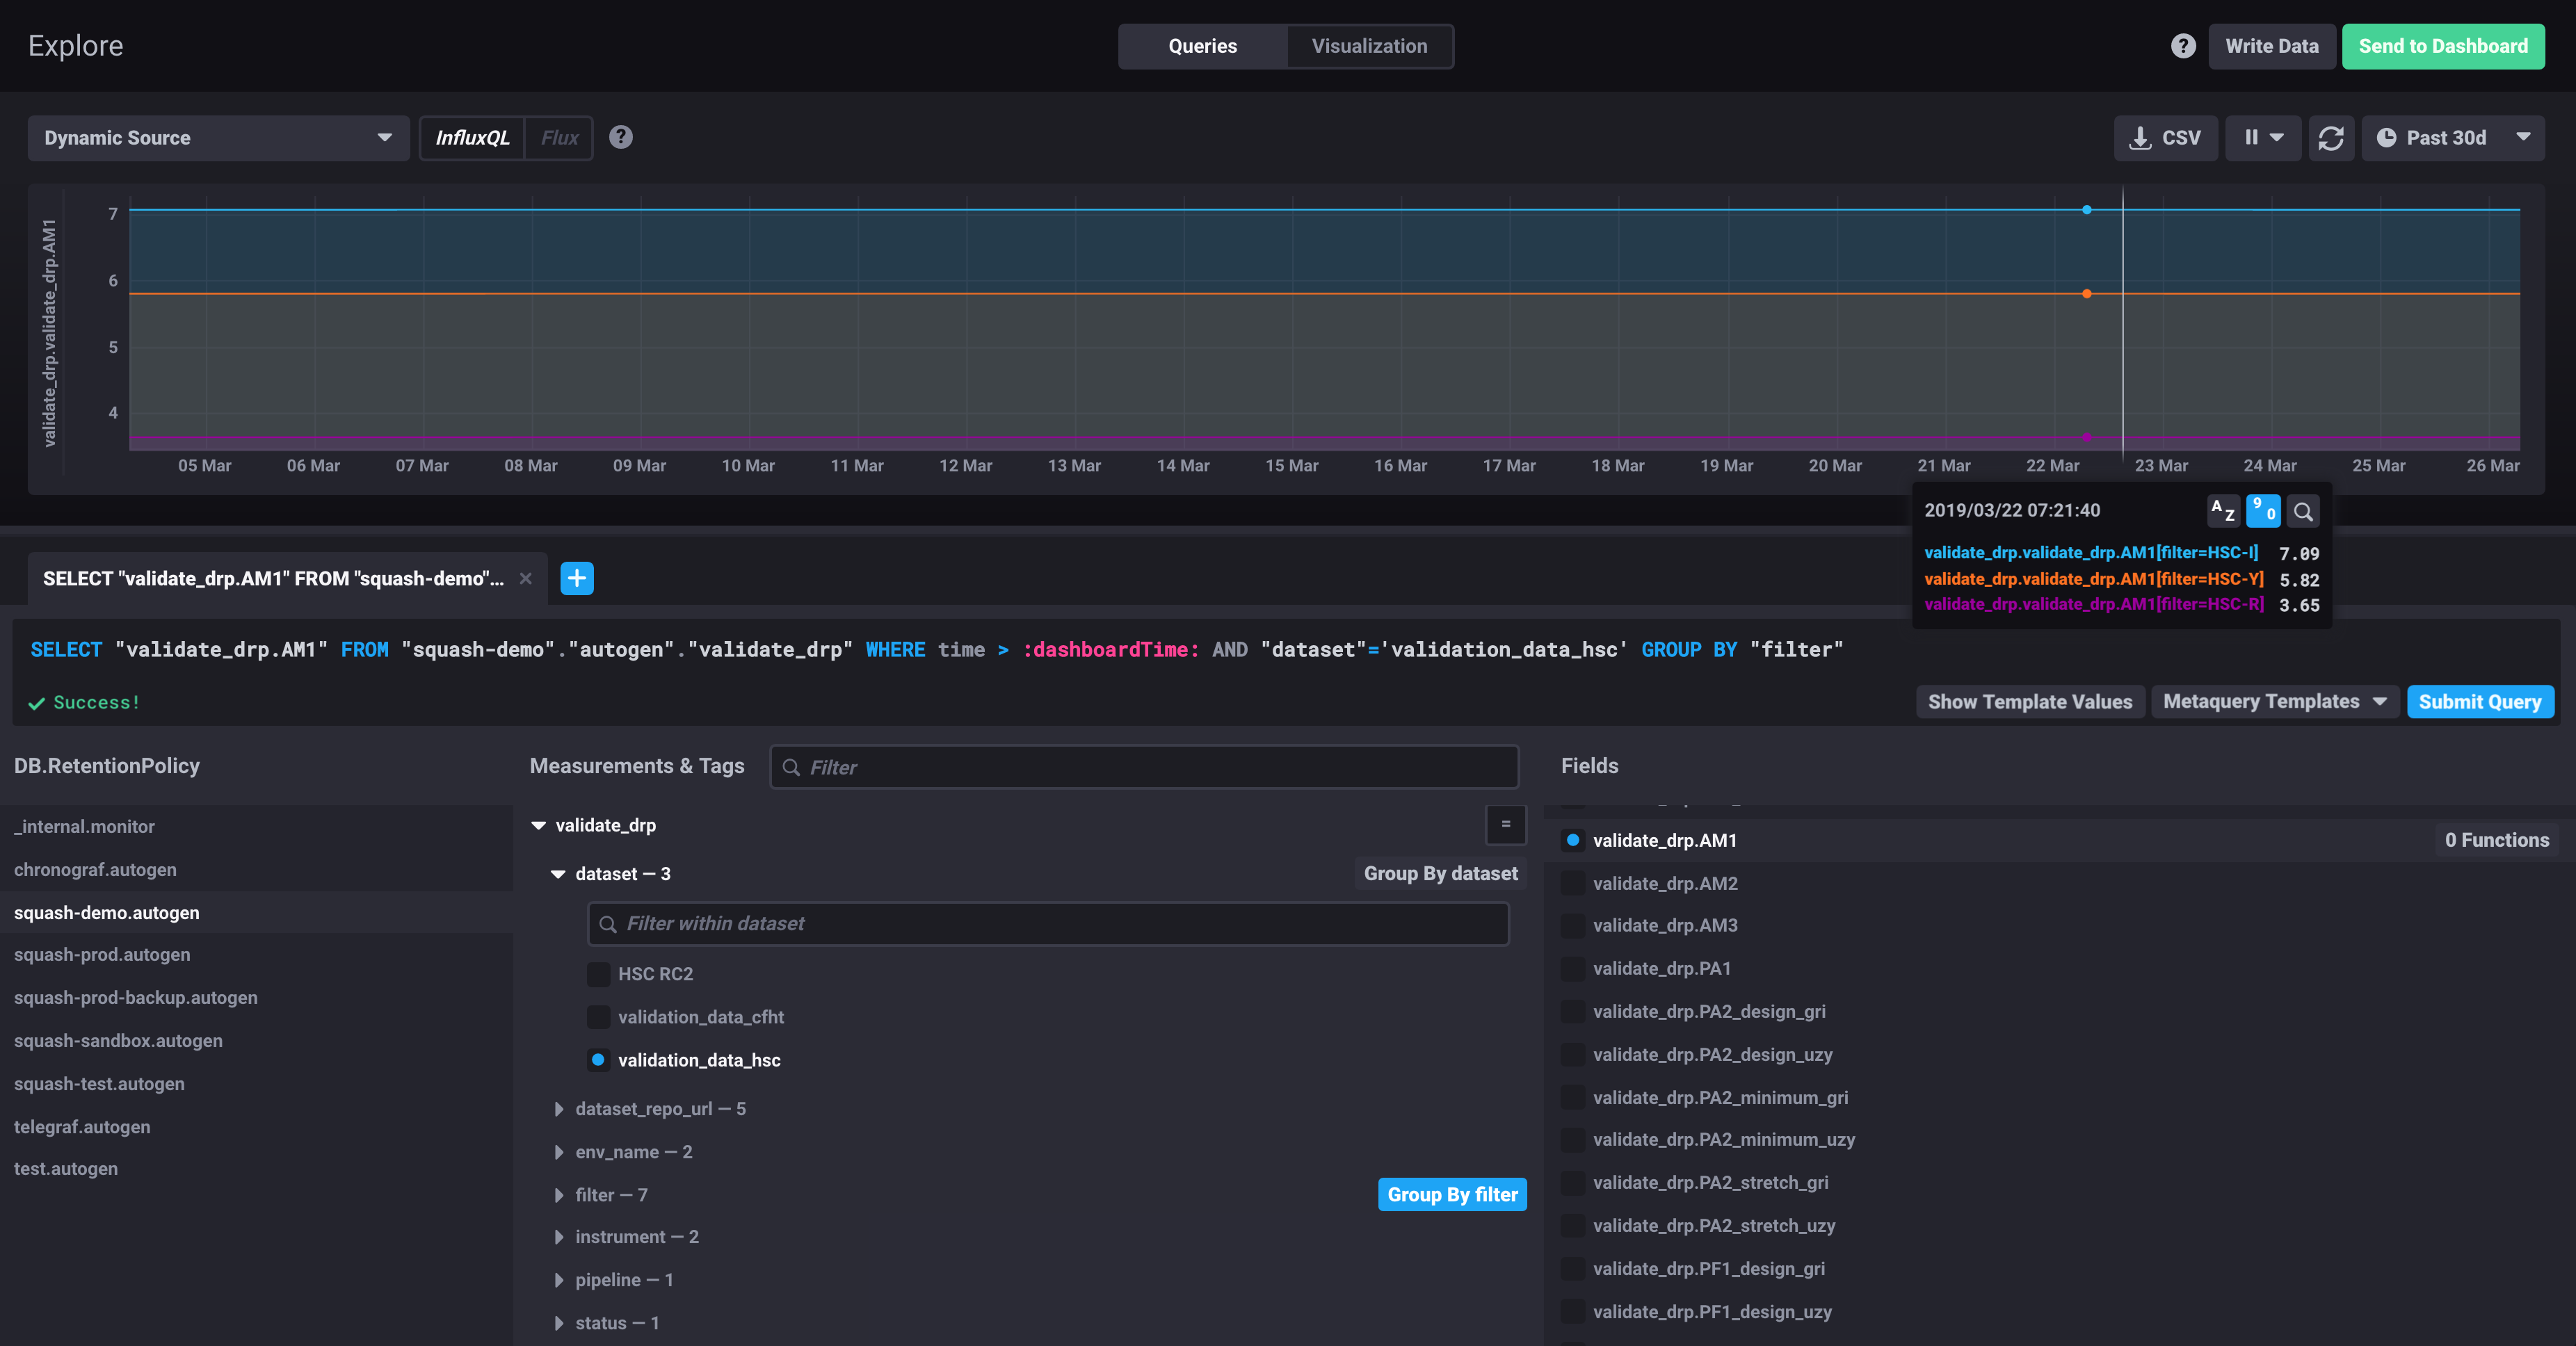
Figure 2 The figure shows how the SQuaSH data model is presented to the user through the Chronograf UI. This particular query displays a time series for the validate_drp.AM1 metric, selecting the validation_data_hsc dataset and grouping the results by filter.
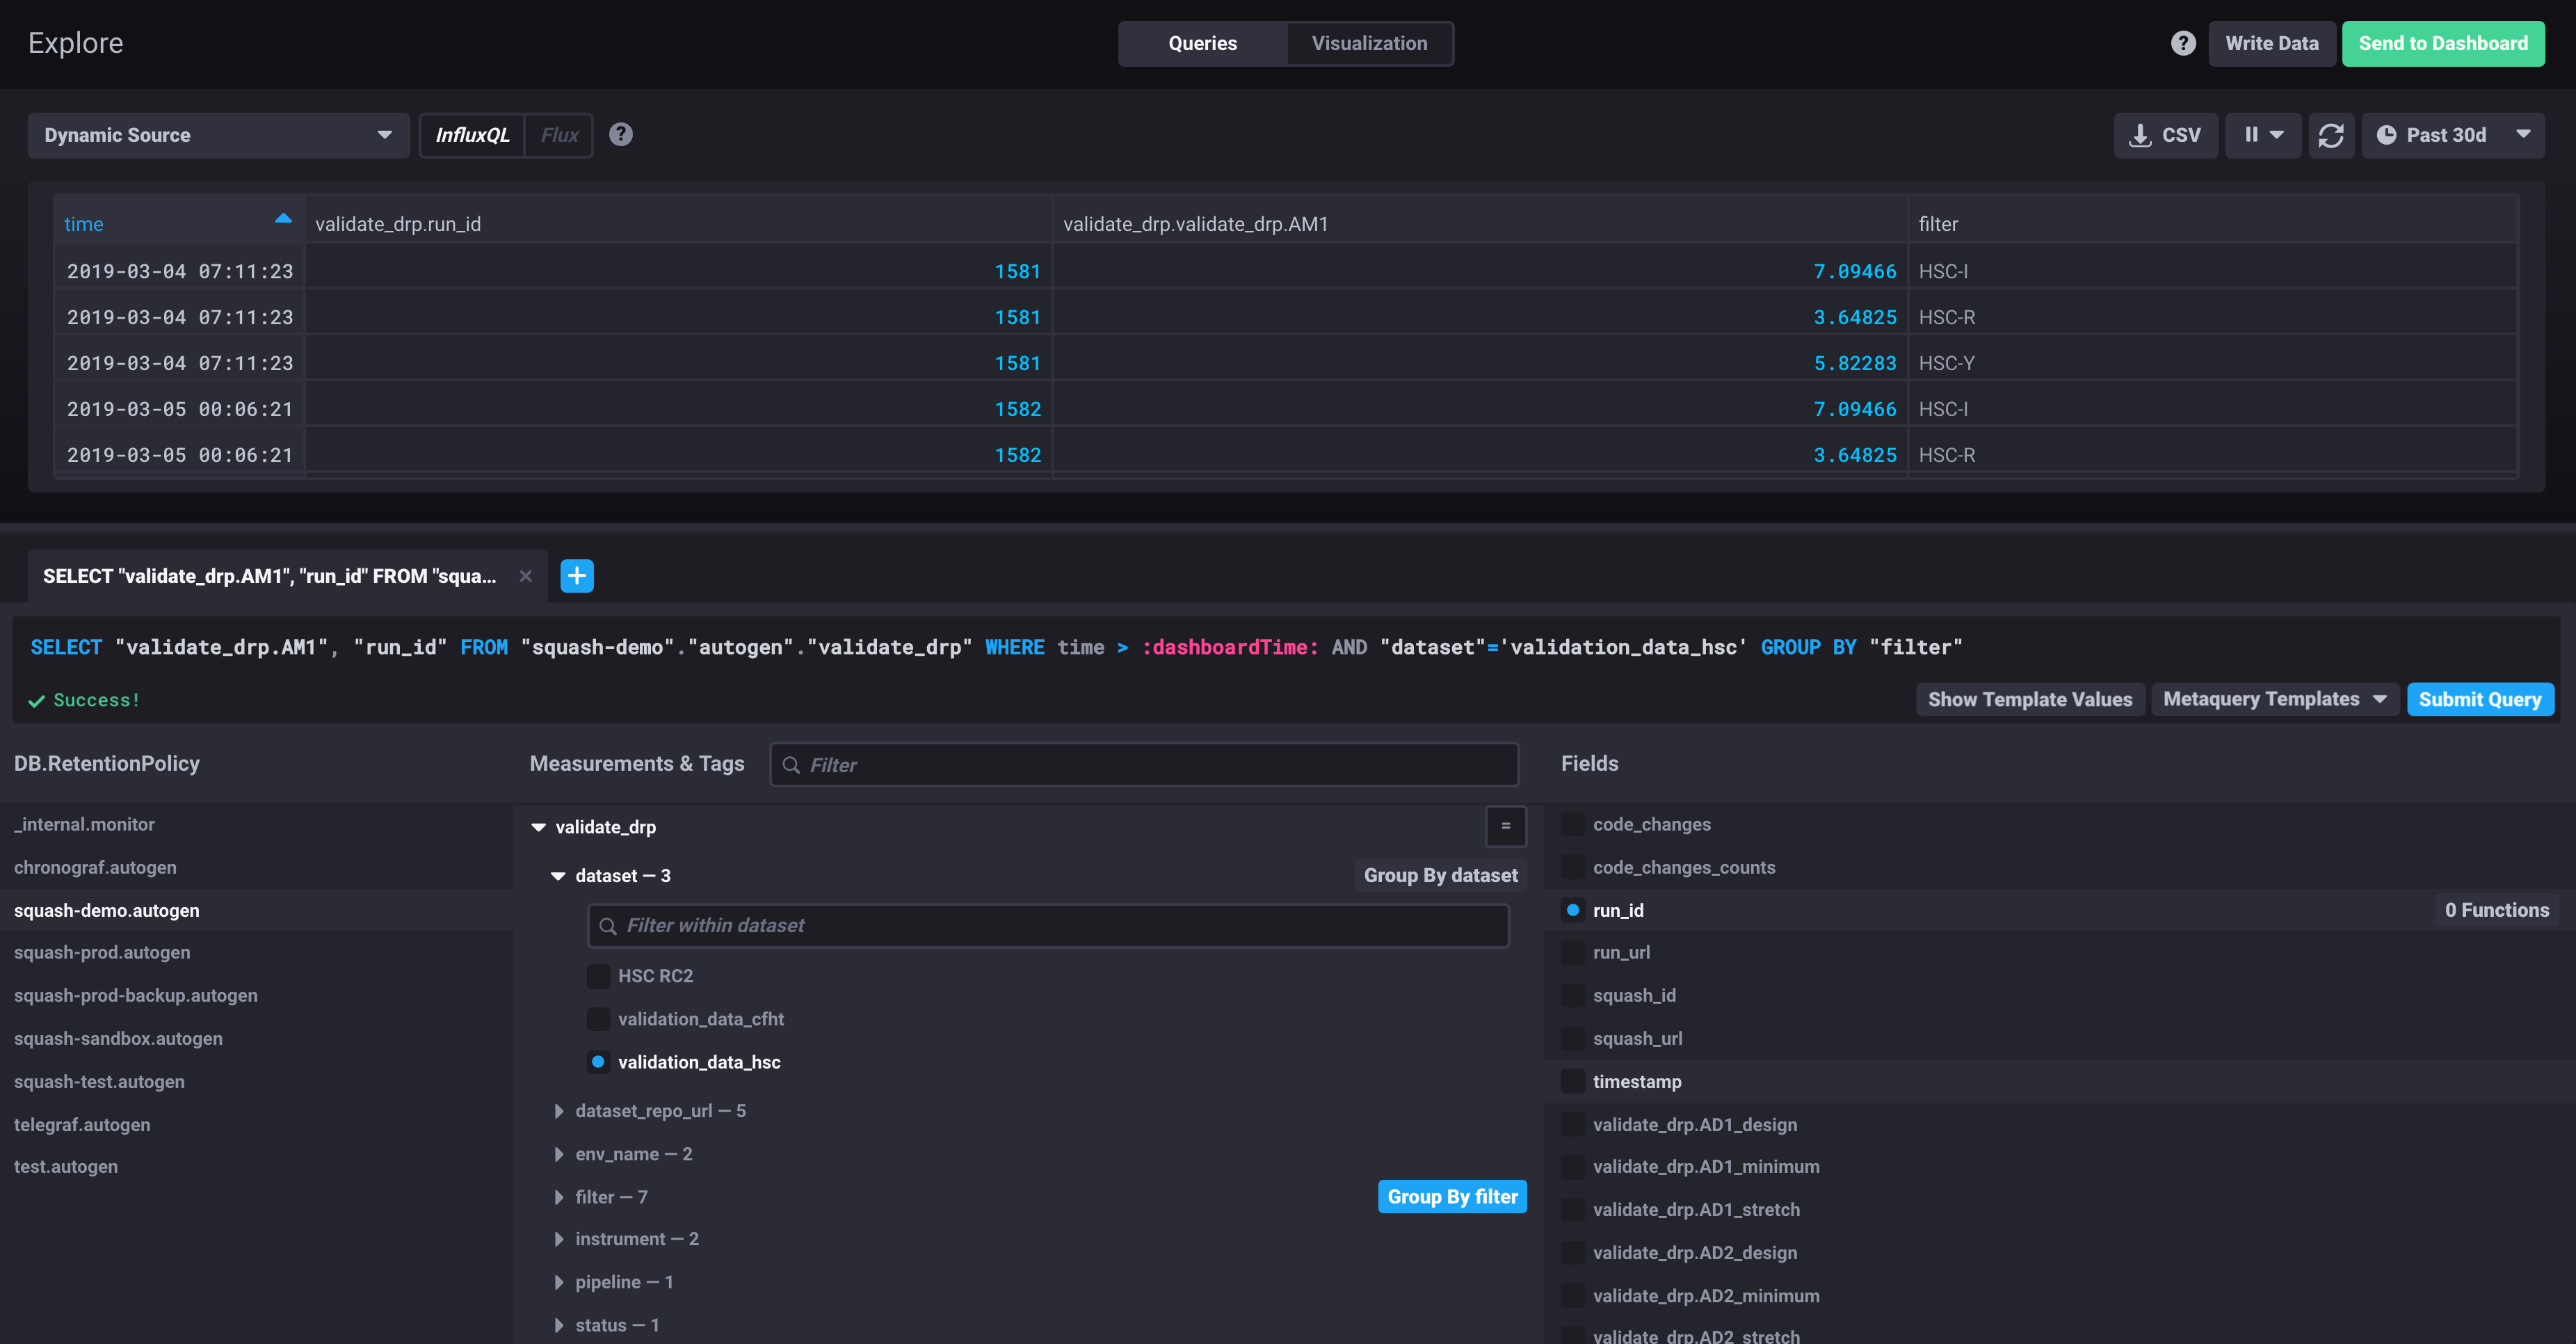
Figure 3 The same query as shown in the previous figure, but now adding the run_id and visualizing the results in a table view.
Alert rules and notifications with Kapacitor
Chronograf is also the UI for Kapacitor, a native data processing engine that can process both stream and batch data from InfluxDB. Although, the user can create alerts through the UI the goal is to create alert rules programmatically from the metric specifications stored in SQuaSH.
Appendix
Supporting multiple execution environments
To be generally useful for the verification activities, SQuaSH must support multiple execution environments.
Examples of metadata for different execution environments:
- Jenkins CI
- Look up key: ID of the CI run
- Environment metadata:
ci_id,ci_name,ci_dataset,ci_url, stack packages.
- LSST Data Facility (LDF)
- Look up key: ID of the pipeline run.
- Environment metadata: run ID, pipeline name, pipeline configuration, butler repository
The SQuaSH API provides a generic resource to interact with verification jobs, /job/<id>, and specific resources to interact with runs on different execution environments. A run may contain results of multiple verification jobs. For example a GET request to /jenkins/<run_id> or to /local/ldf/<run_id> will retrieve the corresponding jobs.
The SQuaSH context database
We adopted a relational database for the SQuaSH context database. The main motivations for this choice is to deploy the SQuaSH context database at the US DF consolidated database (Postres), and to access the SQuaSH metrics through a common TAP interface.
In its current deployment, SQuaSH uses a MySQL 5.7 instance in Google Cloud SQL. MySQL 5.7 offers support to JSON data types which are used to make the database schema more flexible. We store verification job metadata, environment metadata as well as metric definitions and specifications as JSON data types.
Current SQuaSH context database:
- Entities:
env,user,job,package,blob,measurement,metric,spec
- Relationships:
1 env : N jobs1 job : N packages1 job : N measurementsM measurements : N data blobs1 metric : N specs1 metric : N measurements
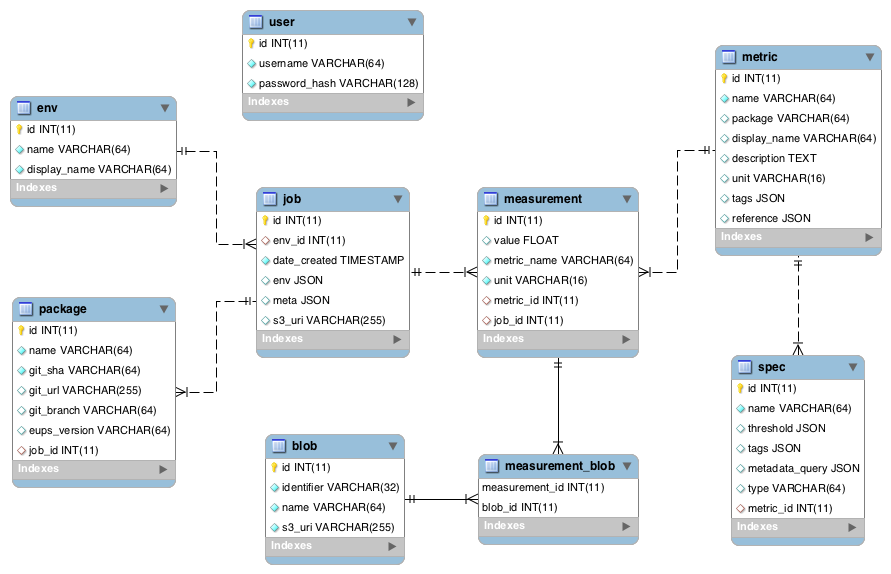
Figure 4 The figure shows the relational schema for the SQuaSH context database.
In the Google platform deployment, the Cloud SQL manages the backups of the SQuaSH context database.
Acronyms
| Acronym | Description |
|---|---|
| API | Application Programming Interface |
| CI | Continuous Integration |
| DM | Data Management |
| DMTN | DM Technical Note |
| HSC | Hyper Suprime-Cam |
| JSON | JavaScript Object Notation |
| LDF | LSST Data Facility |
| LDM | LSST Data Management (Document Handle) |
| LSE | LSST Systems Engineering (Document Handle) |
| LSST | Legacy Survey of Space and Time (formerly Large Synoptic Survey Telescope) |
| QA | Quality Assurance |
| QC | Quality Control |
| REST | REpresentational State Transfer |
| SDQA | Science Data Quality Assessment |
| SQL | Structured Query Language |
| SQR | SQuARE document handle |
| SQuaSH | Science Quality Analysis Harness |
| TAP | Table Access Protocol |
| UI | User Interface |
| URL | Universal Resource Locator |